Live Stream
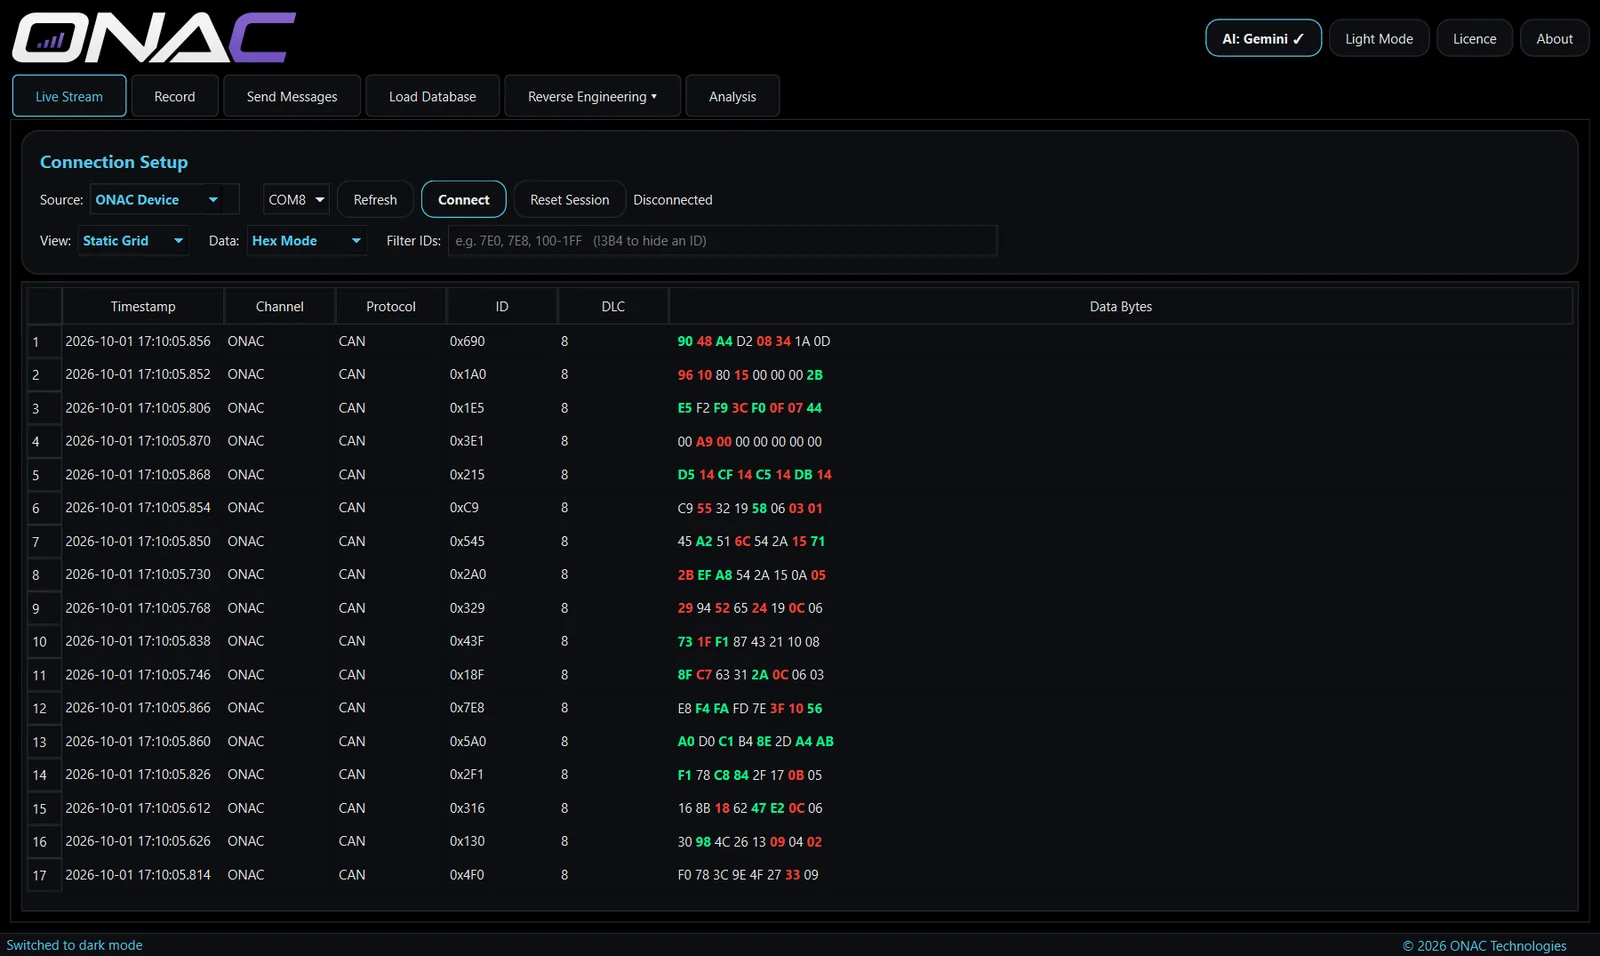
The starting point for any job: connect to the vehicle and see every frame on the network as it arrives.
- Choose your hardware. ONAC device, PicoScope, Mongoose ISO3 or a CANable / candleLight USB-CAN adapter. With a PicoScope, Channel A can be set to CAN (125k, 250k, 500k or 1M), CAN FD, LIN, FlexRay or SENT - LIN speed and SENT tick time are detected automatically - and a set-up guide shows how to connect the probe, with the voltage range set for you.
- CANable / candleLight adapters work straight from USB with no driver to install. They connect listen-only, so they never affect the bus, and Auto-detect finds the baud rate for you. If the bus can't be read cleanly, the app tells you the likely cause - wrong speed, wiring or ground.
- FlexRay live through a PicoScope and a 10:1 probe on Bus Plus, every frame checksum-verified. A safety notice and set-up guide appear before you start, and the app warns if the probe connection looks wrong. Slots that carry different messages in different cycles can be split into separate messages. FlexRay logs decoded in PicoScope's own software can be loaded too.
- CAN FD live through a PicoScope (new - not yet tested on a vehicle): up to 64-byte frames, with the data bit rate found automatically.
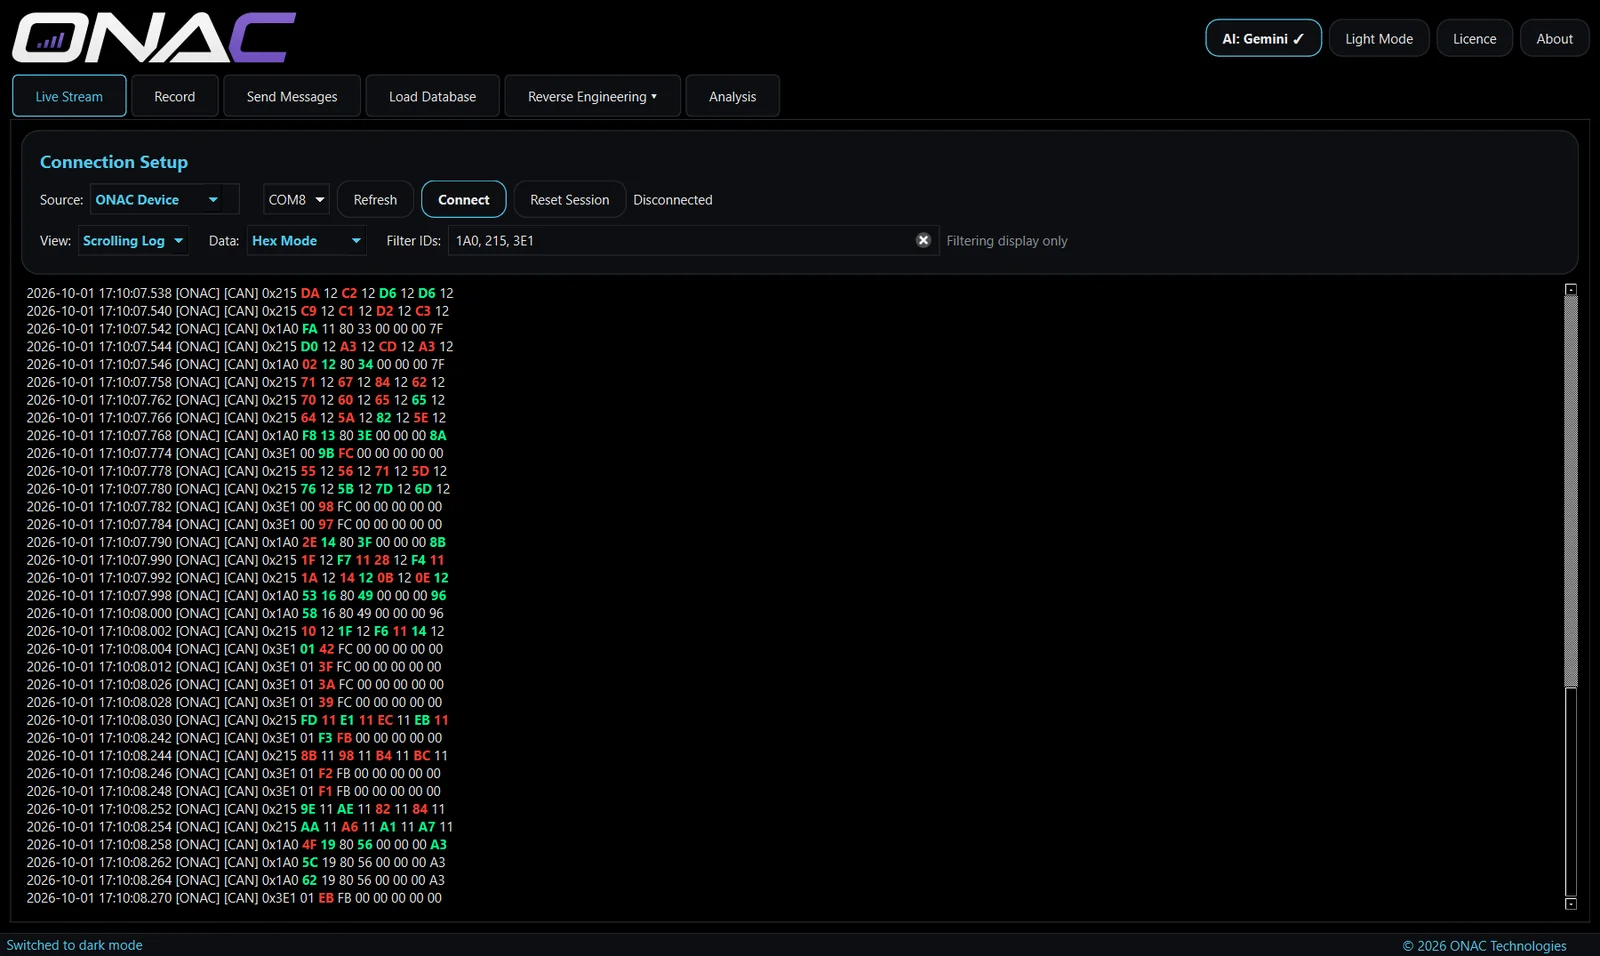
- Two views. Scrolling Log lists every frame in time order — ideal for seeing sequences and event-driven messages. Static Grid keeps one row per ID and updates it in place, so the bytes that are changing jump out.
- Hex, decimal or bit view of the data bytes. Bit mode is the quickest way to spot a single switch or flag toggling.
- ID filter. Type a list of IDs to watch only the messages you care about.
- Separate or combined channels when more than one network is connected.
Record
Capture a session to analyse later, with everything you need to know what the vehicle was doing at the time.
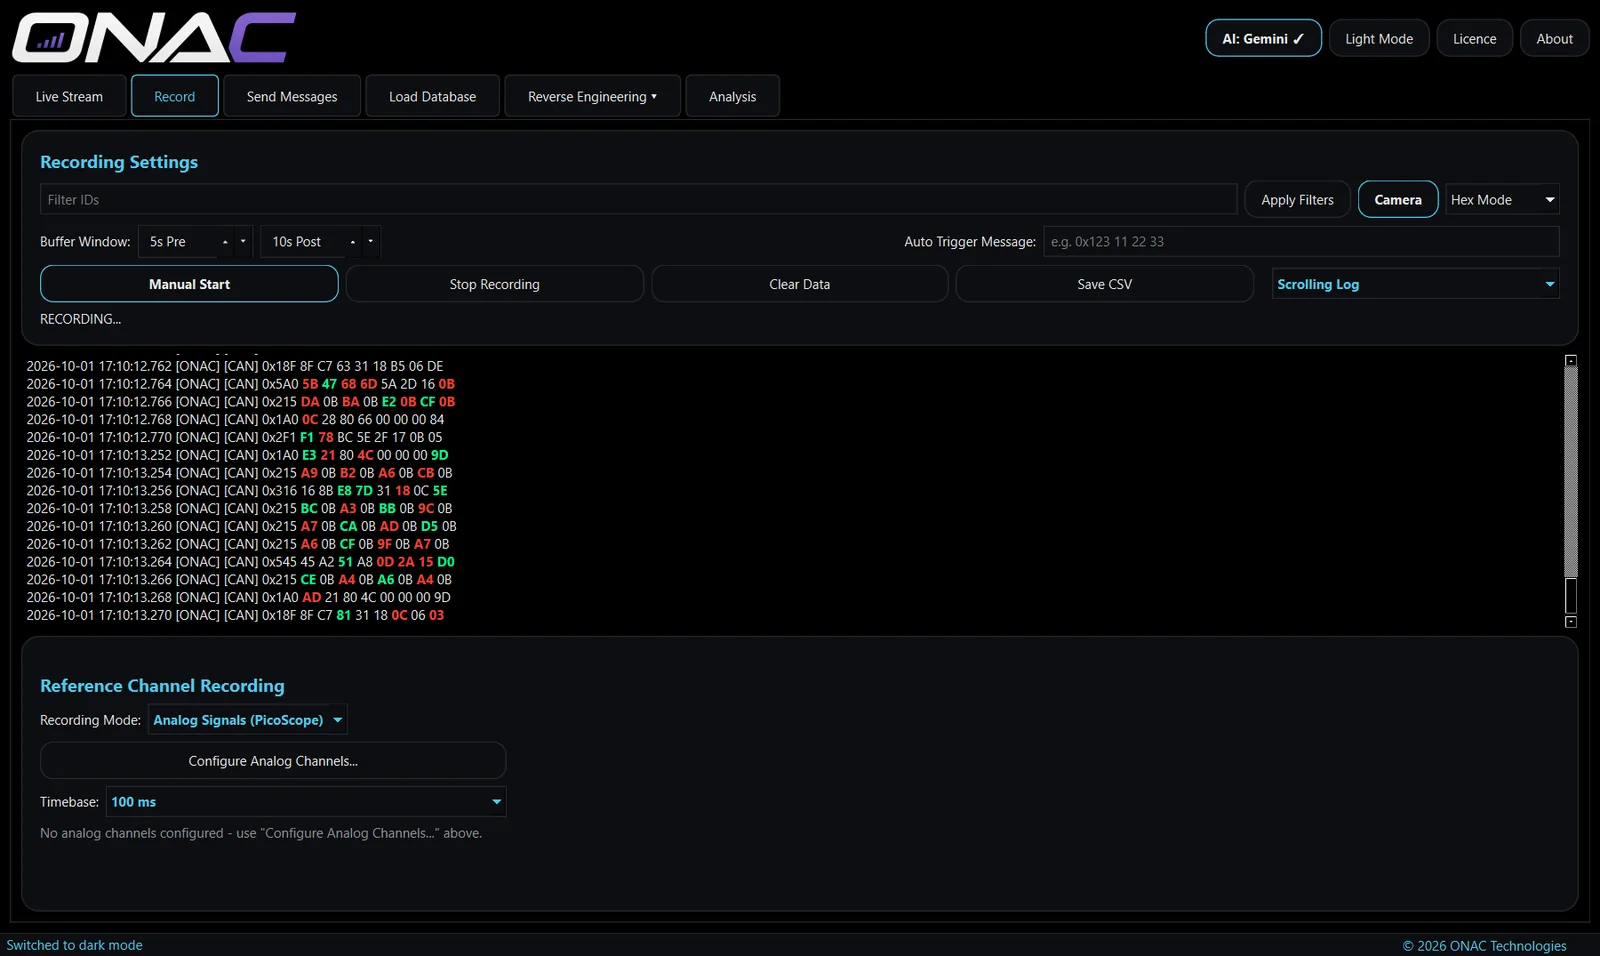
- Start manually or on a trigger. Type a trigger message, press Set Trigger, and recording starts automatically when it appears — no need to be at the laptop when the event happens. The capture is kept until you set the trigger again.
- Pre- and post-trigger buffers keep the seconds before and after the event, so you capture the build-up as well as the moment itself — the full pre-trigger window, even on a busy bus.
- Recording filters to keep only the IDs that matter and keep files small.
- Camera recording alongside the network data, on the same timeline.
- Reference channels. Record PicoScope analog inputs (voltage range and timebase selectable), or use manual sliders and toggles to mark what you were doing — "brake on", "throttle 50%" — while recording.
- Save as CSV, raw or decoded, ready for Analysis or any other tool.
Load Database
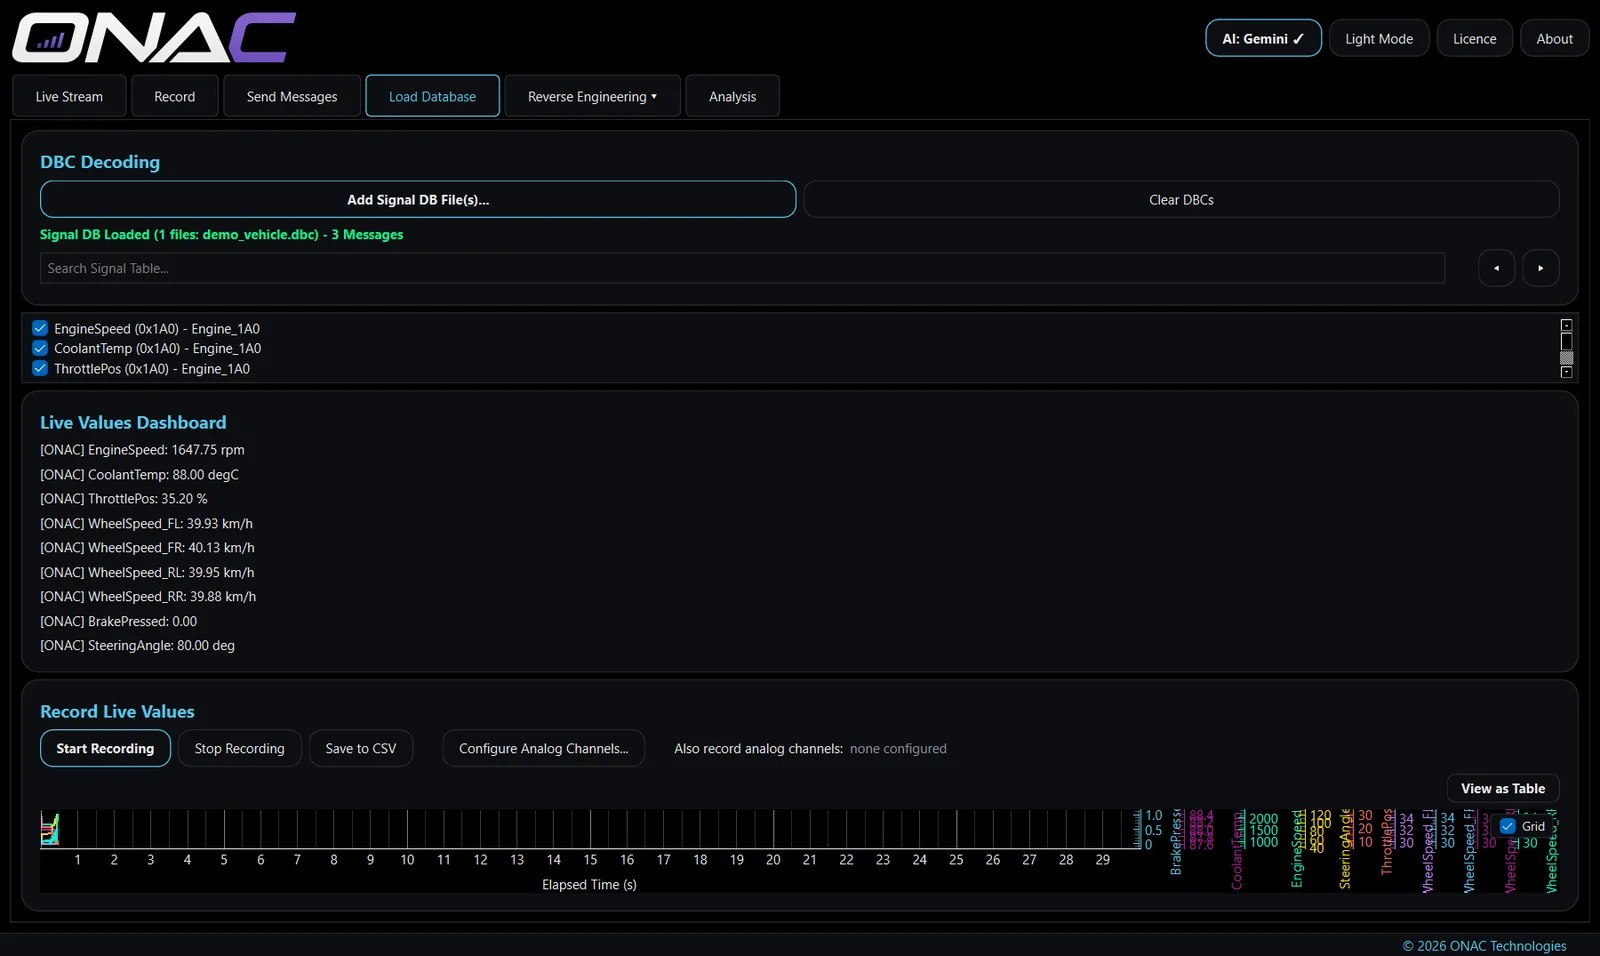
When you know what's on the network, load the database and see real engineering values instead of raw bytes.
- DBC, LDF and FIBEX. DBC for CAN (and SENT signal definitions), LDF for LIN, FIBEX (
.xml) for FlexRay logs. Load several at once — they all decode together. - Live values dashboard. Tick the signals you want and watch them update as named, scaled values with units — engine speed in rpm, wheel speeds in km/h, steering angle in degrees.
- Record live values to a decoded CSV, including any analog reference channels.
New to databases? Our guide to DBC files and signal decoding explains how a raw frame becomes a value.
Reverse Engineering
When there's no database for the vehicle, this is where you build one. There are three approaches, from fully manual to fully automatic, and they all end in the same place: a database file you can reuse.
Standard — signal miner
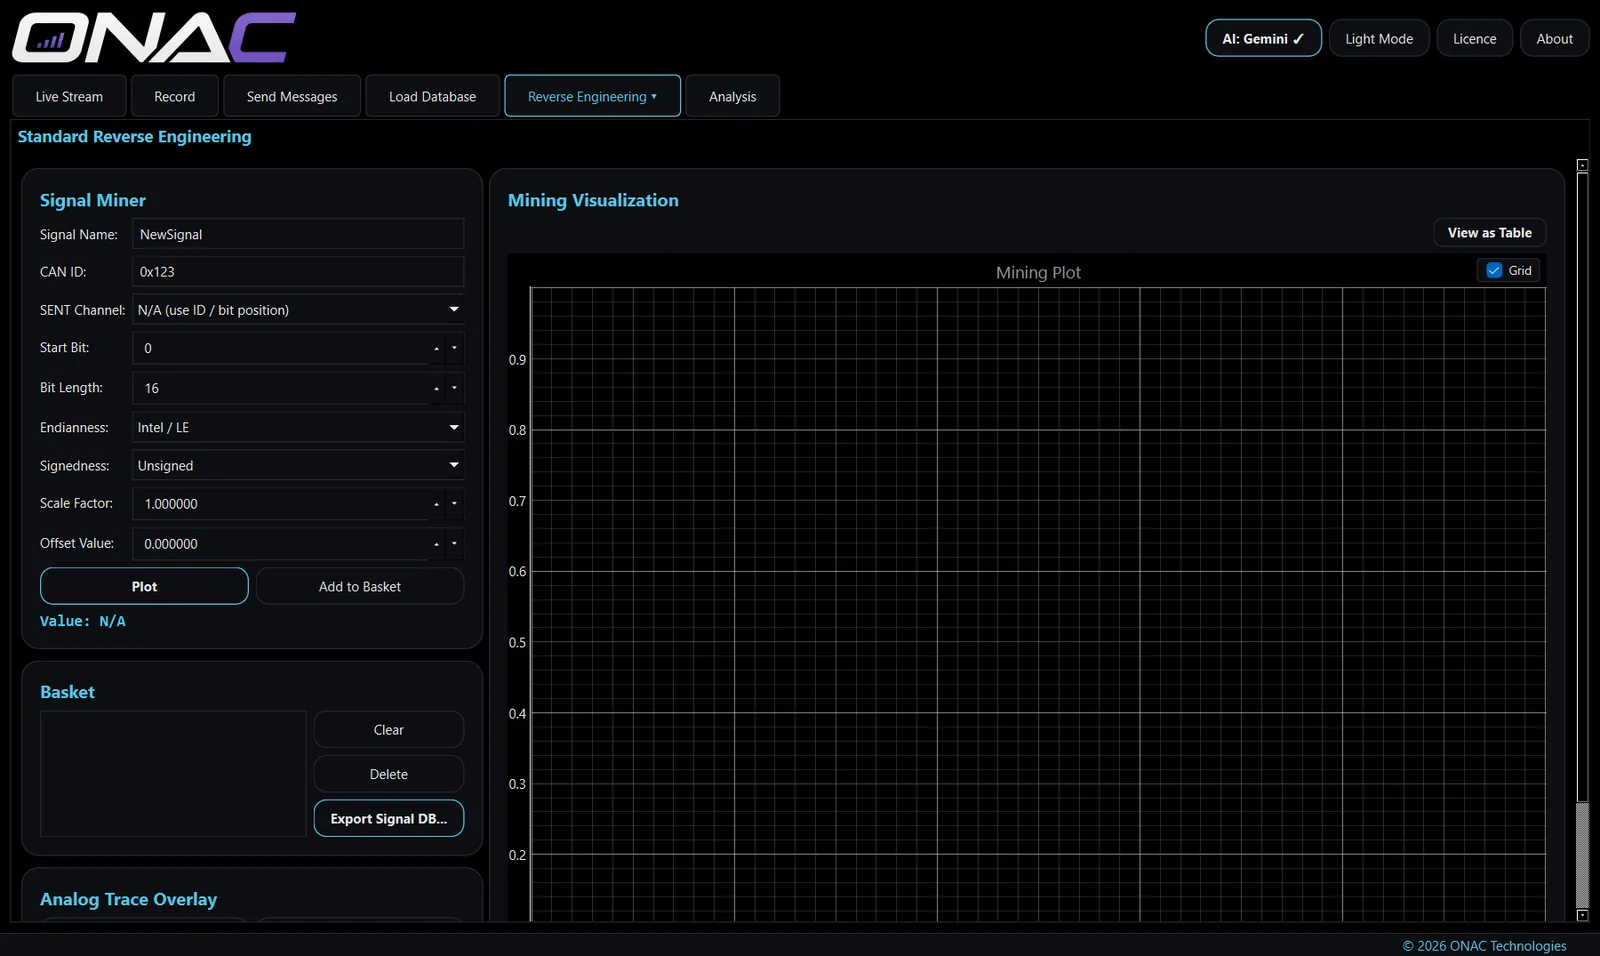
- Pick a message and inspect any run of bits as a value: start bit, length, Intel or Motorola byte order, signed or unsigned, scale and offset.
- Plot candidate signals over time and overlay an analog trace to confirm a match.
- Collect confirmed signals in a basket and export them as DBC, LDF or FIBEX.
Live Reverse Engineering
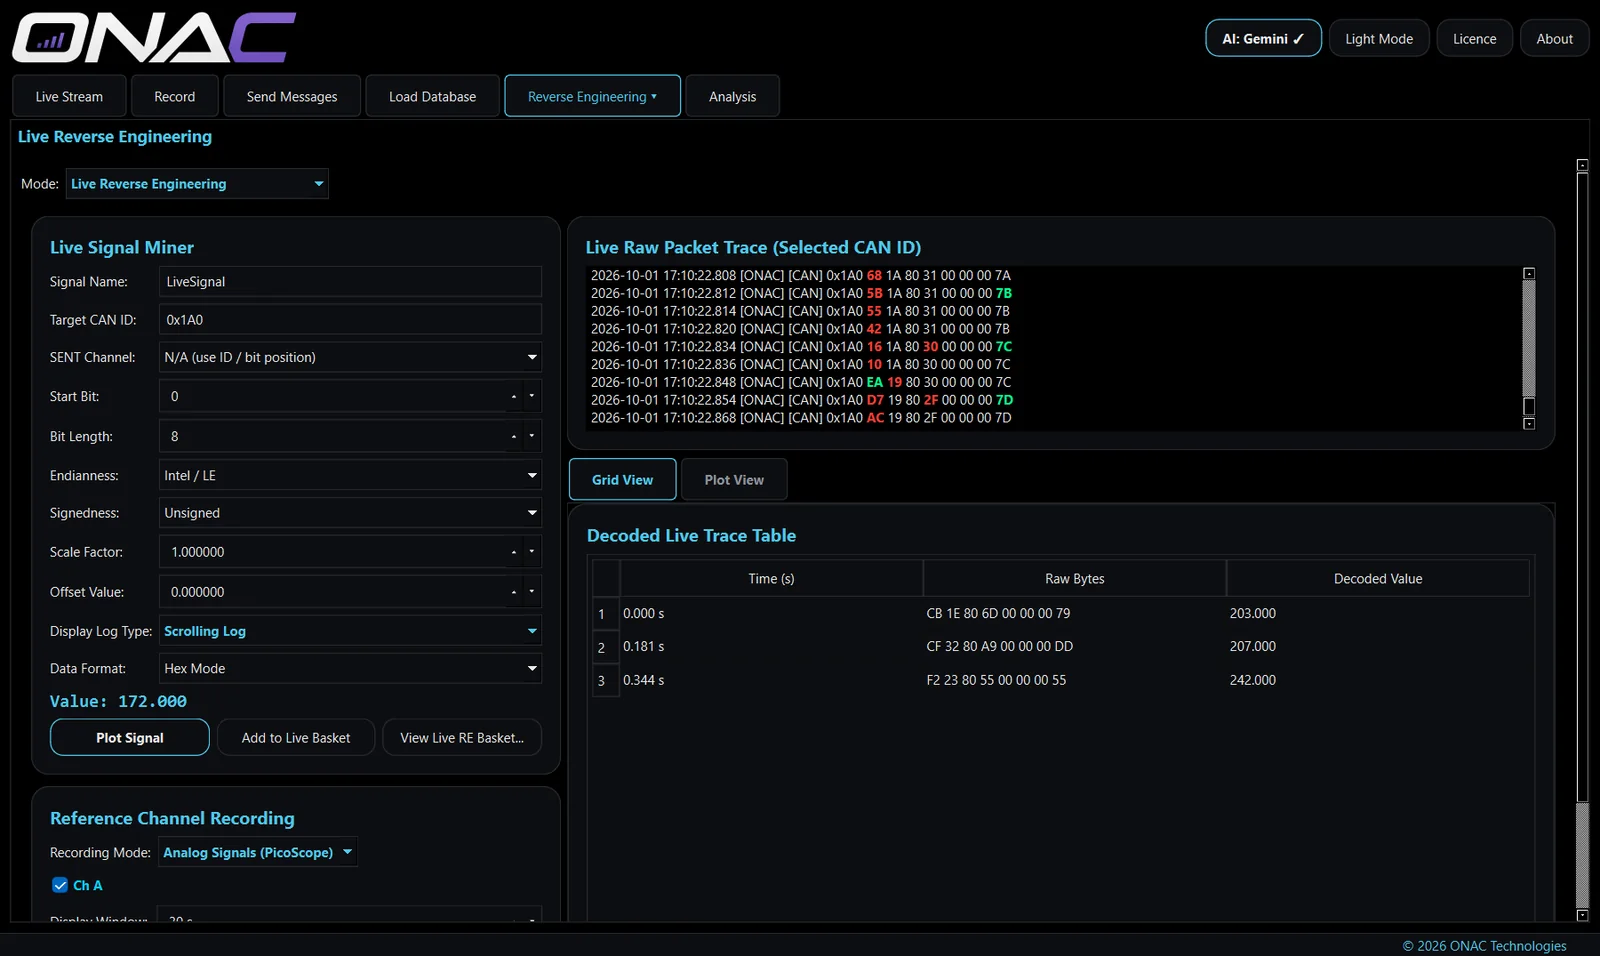
Watch a single ID live while you operate the vehicle. Each bit and byte is shown as it changes, so you can press a pedal or flick a switch and see exactly which bits respond. Analog reference channels from a PicoScope, or manual sliders, can be shown alongside for comparison.
Guided Test
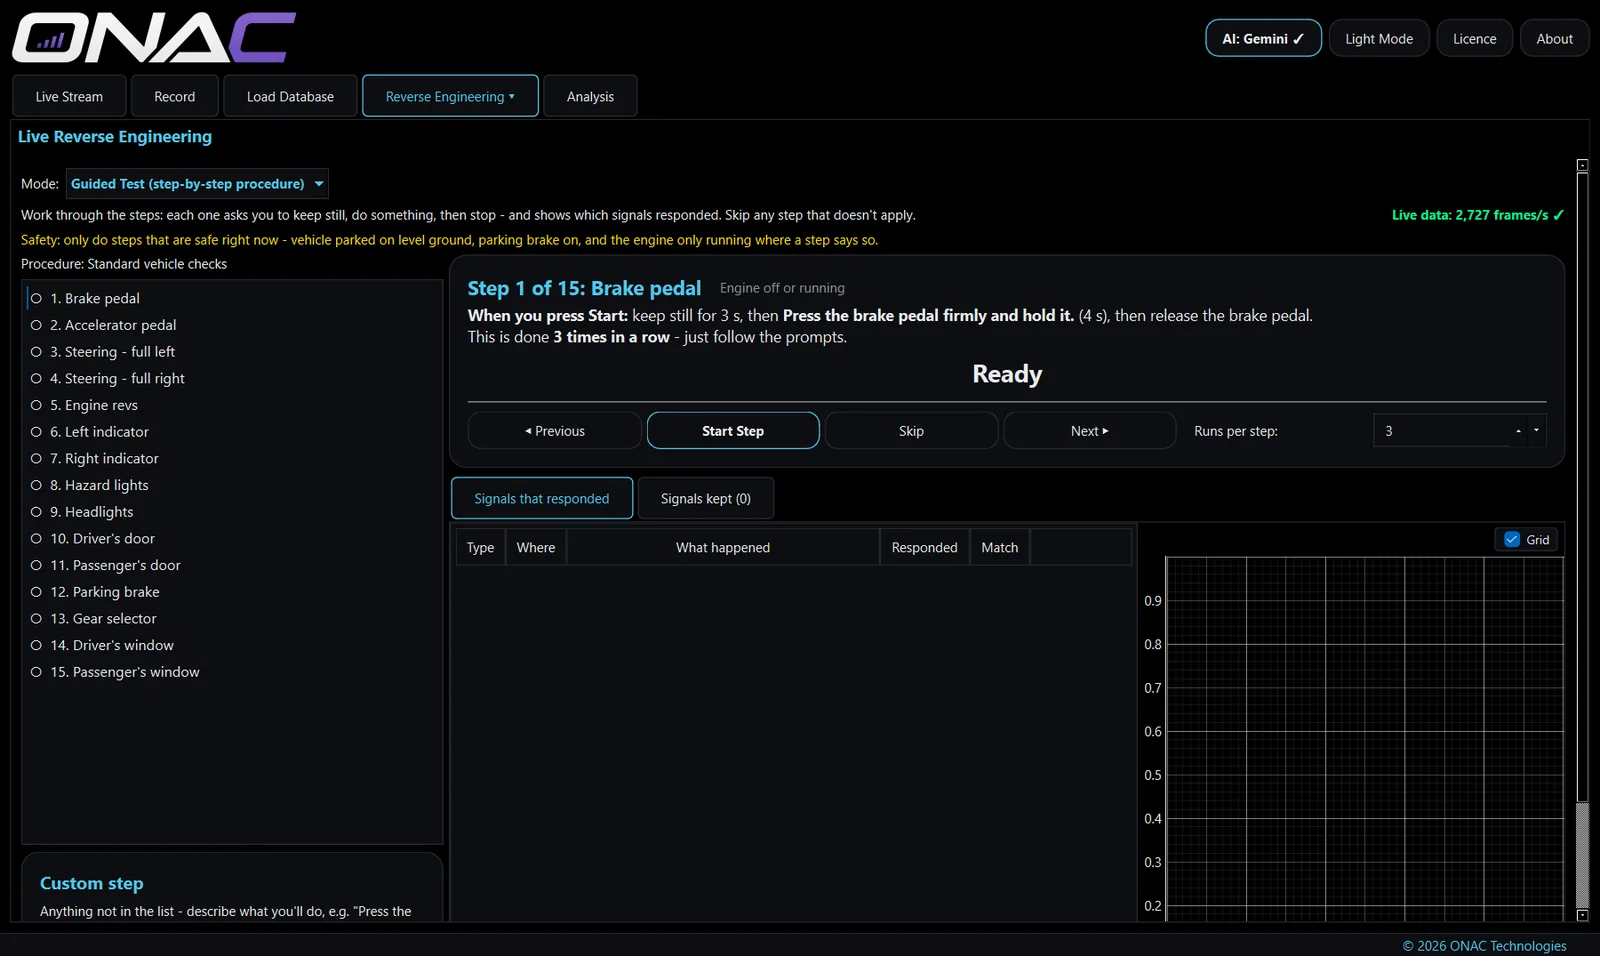
A step-by-step procedure that does the detective work for you. For each step the app asks you to keep still, do the action, then release — and lists the signals that responded, in plain English, with a graph.
- 15 standard steps: brake and accelerator pedals, steering full left and right, engine revs, indicators, hazards, headlights, both front doors, parking brake, gear selector, and both front windows. Every step is done with the vehicle stationary.
- Pro only: a 16th step for vehicle and wheel speed, which involves driving the vehicle, is included only in Network Studio Pro for approved users.
- Skip, repeat or revisit any step, and add your own custom steps.
- Run each step more than once to make the results more reliable.
- Scale signals from real readings (e.g. "the rev counter showed 3000 rpm"), choose the ones to keep, and export a signal database - DBC, LDF or FIBEX depending on the bus.
Automated Reverse Engineering
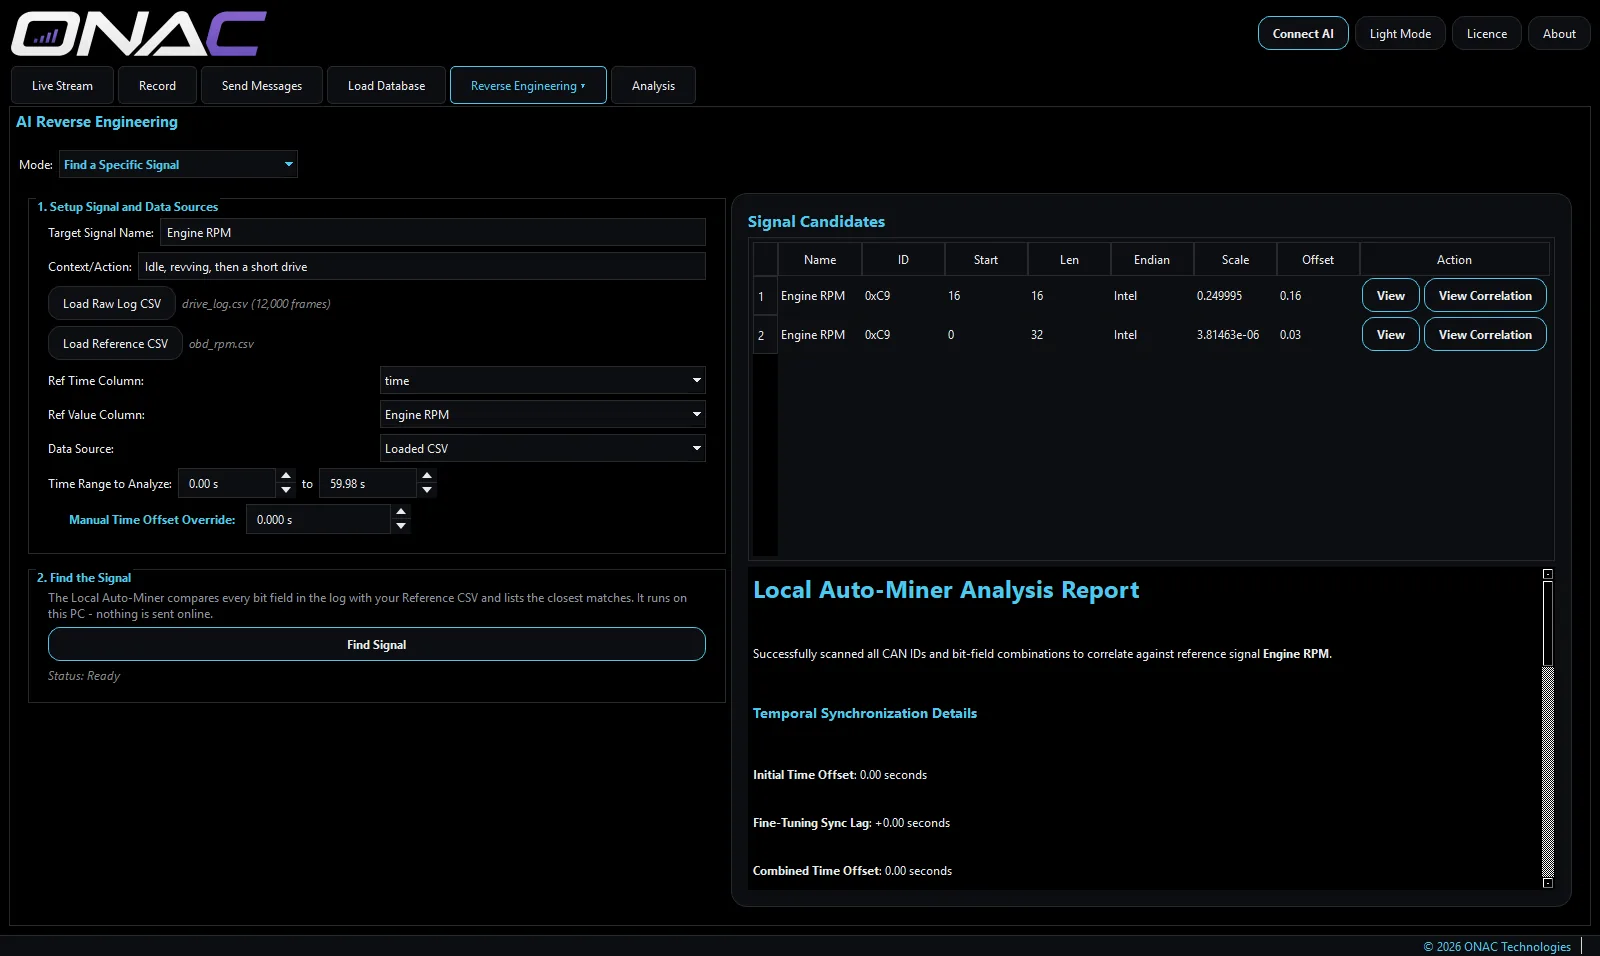
Find a Specific Signal. Load a reference CSV of known values recorded during the same drive — from an OBD reader or a dashboard recording, for example — and pick a time range. The Local Auto-Miner compares every bit field in your recorded or loaded log with those values, lines up the two clocks for you, and lists the closest matches with their scale and offset. It runs entirely on your PC: no internet, and nothing leaves your computer.
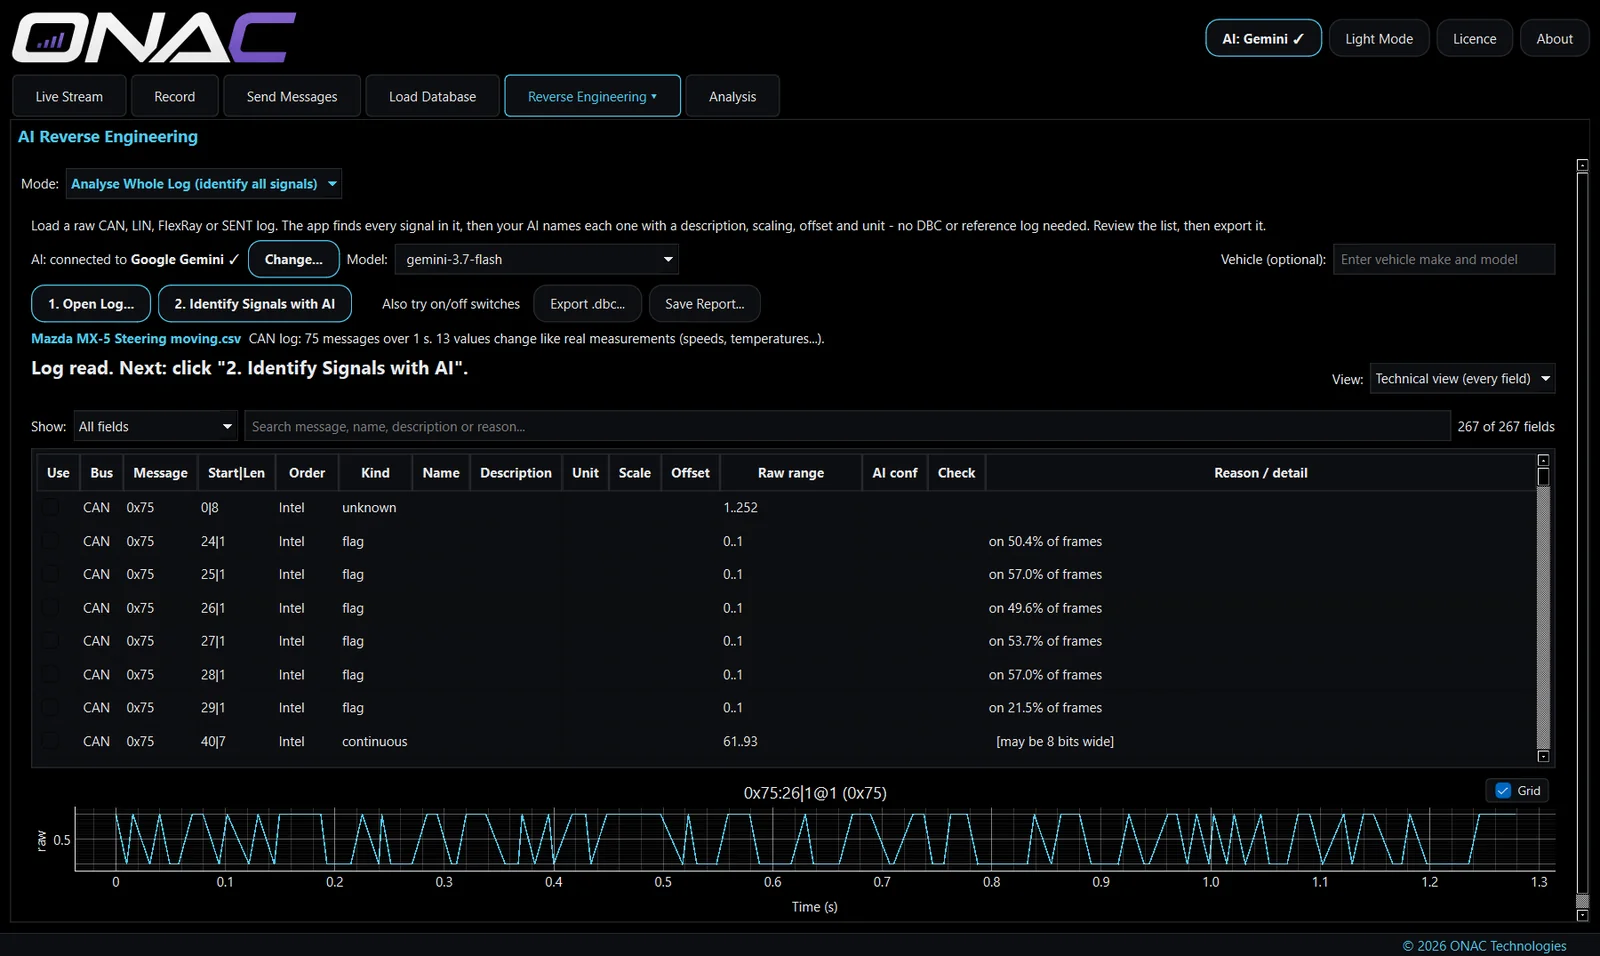
Automated Log Analysis. Point it at a CAN, CAN FD, LIN, SENT or FlexRay log, and it works through every message to identify the signals it can — counters, checksums, speeds, temperatures, switches — then produces a report and an exportable signal database (DBC, LDF or FIBEX). Switch between a plain-English summary and a technical view with graphs of each signal.
Analysis
Everything you need once the session is over.
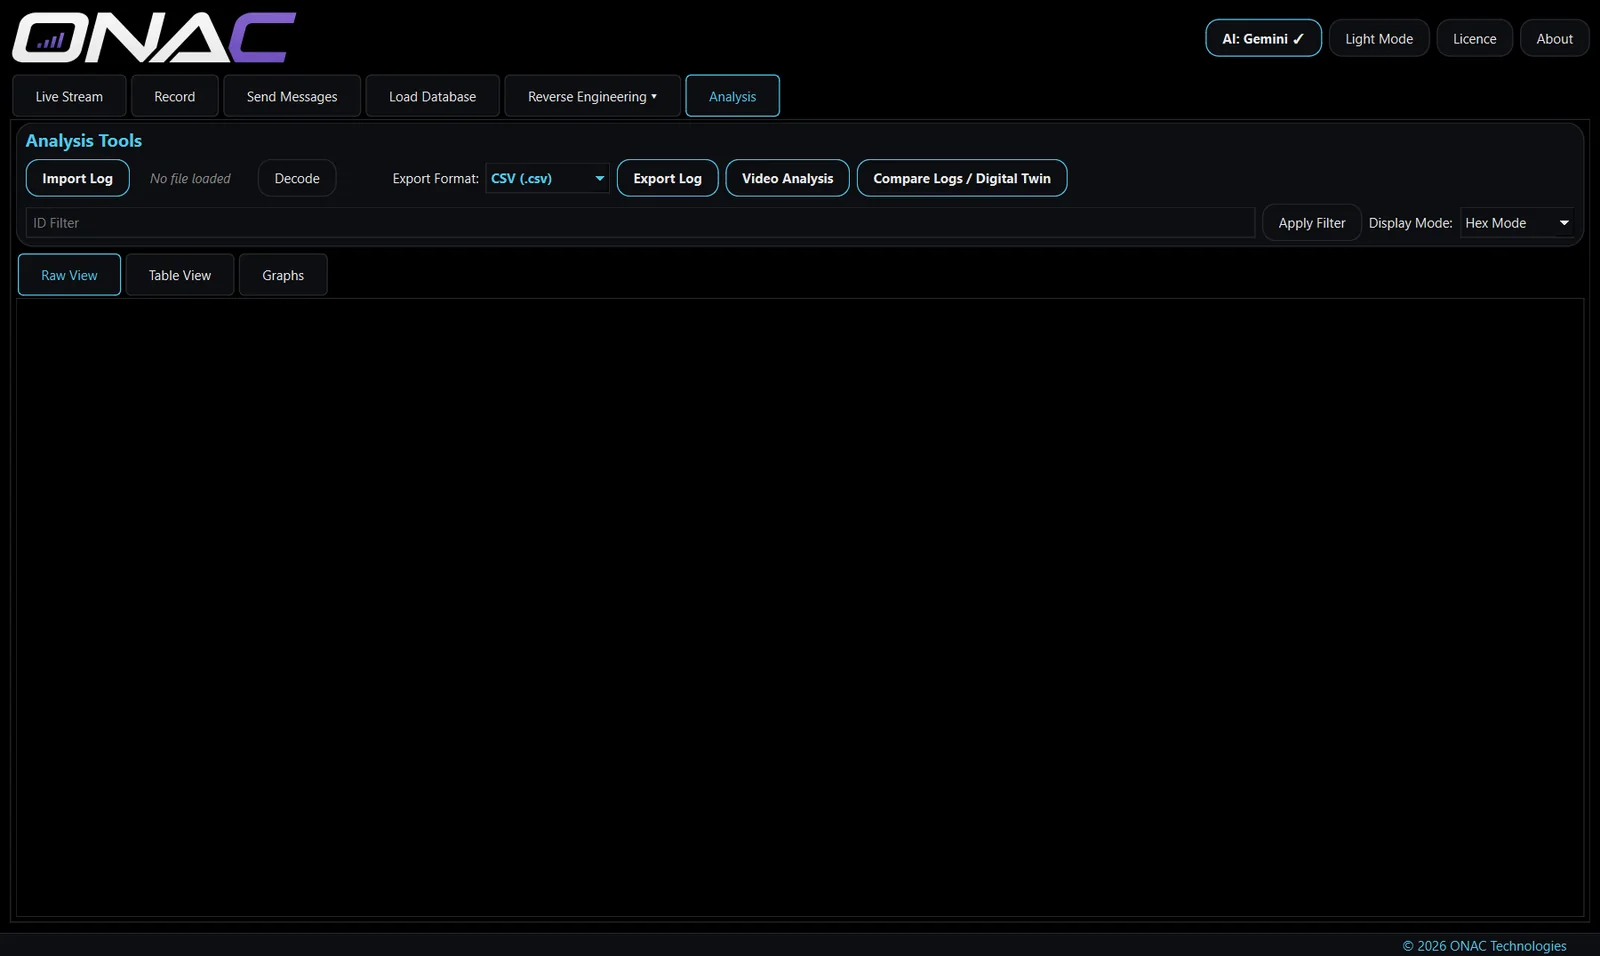
- Import logs from CSV or MF4 (including CANedge MF4 files) and decode them with your loaded databases.
- Export decoded data to CSV, MATLAB
.mat, MoTeC.ldor MDF.mf4— straight into the tools your team already uses. - Video analysis. Play recorded video in step with the data, so you can see what the vehicle was doing at any point.
- Compare Logs. Put two sessions side by side and find what's different — the fastest way to find the message behind a feature that's in one car and not another.
- Digital Twin builder. Pull out the IDs that only appear in one of two logs to build a model of a specific module.
Send Messages
Transmit your own frames onto the network — for bench testing modules, verifying a decoded signal by driving it, or replaying a captured event.
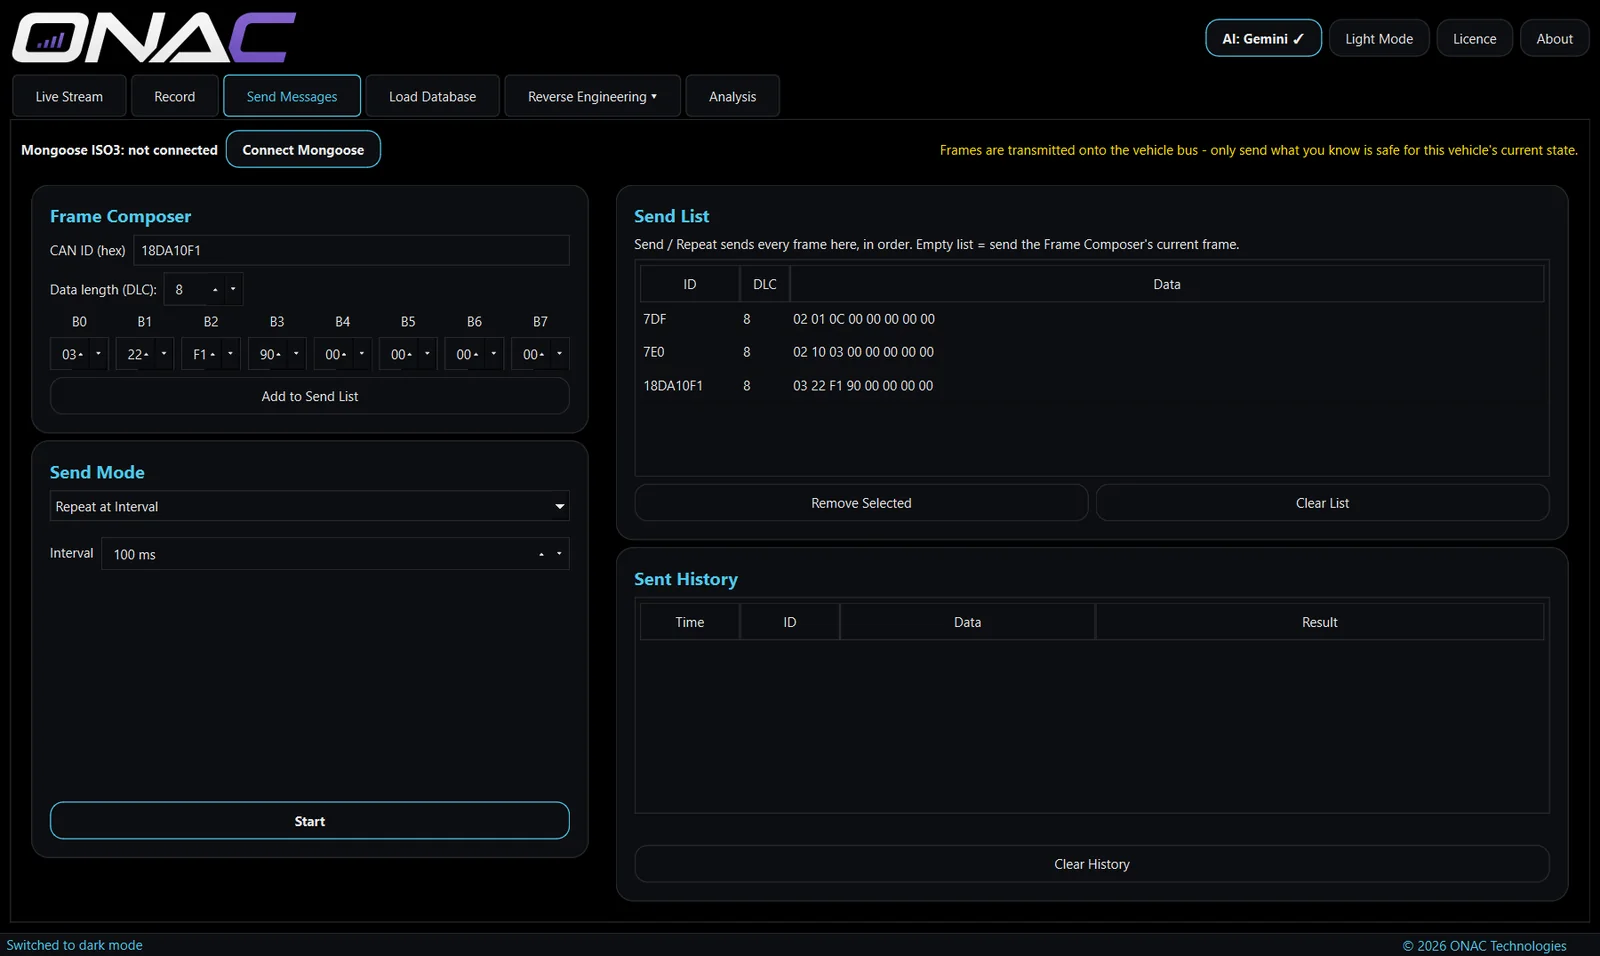
- Frame composer. Enter an ID and edit the data bytes. IDs above 7FF are sent as 29-bit extended IDs automatically.
- Send list. Build up a list of frames and send them once, repeat them at a set interval (10 ms upwards), or replay a recorded CSV log with its original timing.
- A history shows every frame sent and whether the interface confirmed it.
- Sends CAN through a Mongoose ISO3 or a CANable / candleLight adapter, sharing the same connection as Live Stream, and stops automatically if the interface disconnects. With a CANable, a frame only shows as sent once another module on the bus has acknowledged it.
Because transmitting can change how a vehicle behaves, Send Messages is only in Network Studio Pro, which is available to approved professionals. Request Pro access.
Activation and your licence
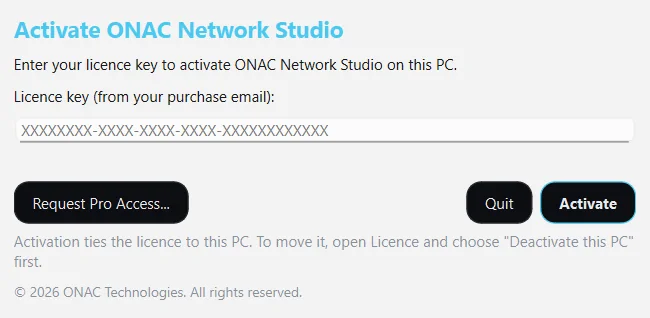
- Paste your licence key into the activation window the first time the app opens.
- Each key works on up to two PCs. To move it, choose Licence → Deactivate this PC first.
- The app checks in with our licence service occasionally, and keeps working offline for up to 14 days between checks.
- Manage or cancel a monthly subscription any time from the Licence window.